The wide implementation of the internet was a complete game-changer for companies. Nowadays, you require a vast amount of information about your customers to make informed decisions. A Business Intelligence mechanism (BI) is a necessity for our fast-paced digital age. Our business intelligence consulting team created this article to share some tips about the making of BI dashboards.
The 101 of BI Dashboards
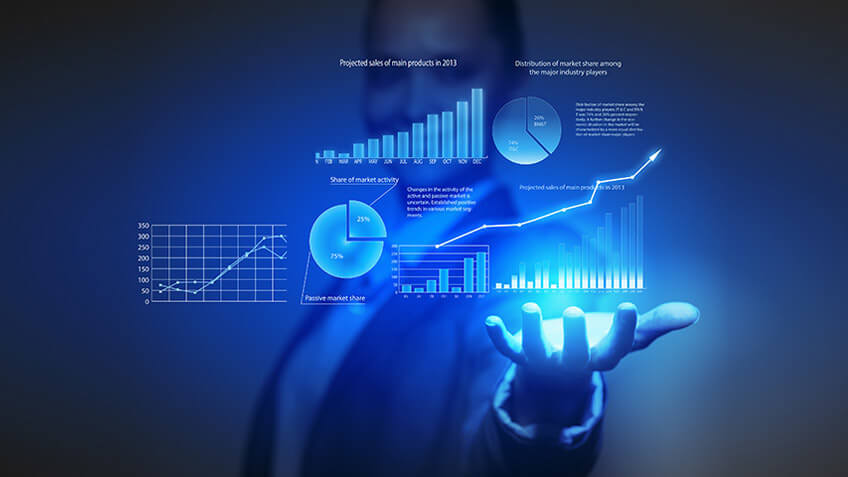
In essence, a business intelligence dashboard is an information management tool that uses data visualization to display KPIs (key performance indicators) tracked by a business to assess various aspects of performance while generating actionable insights.
It is a tech-driven approach that companies use to analyze and visualize information in a comprehensive way. A good BI dashboard gives a reader information about the big picture of the situation via graphs and charts on a single screen. This allows us to quickly understand the state of things and look for the solution. However, the business analytic consulting teams change and adapt the dashboards according to the business’s situation.
5 Tips for the Dashboard Creation

Our team has worked on dozens of projects from all over the planet. In the next part, we will list the top 5 BI dashboard practices we utilize during our work. We put a lot of work into making these tips easily understandable.
1. Identify what information you need
This part can be obvious to you, but we can’t stress the importance of this enough. You need to identify your target audience. Knowing your reader is the most important thing you need to understand while creating the dashboard. The readers have particular expectations from the dashboard. Identifying the audience will allow you to focus your attention on the things that will be interesting for your readers.
2. There are many types of dashboards
In the previous parts, we mentioned that the dashboard is a way to analyze and showcase the information in an easily understandable way. Thus, it is not surprising that this analytical tool comes in many different types. Read about them and pick the one that will suit you best.
Analytical: This type of dashboard answers the three “W” questions: the what, the why, the how. This dashboard solution is focused on understanding the data relative to time. The main goal of the analytical dashboard is to align the actual performance with the objectives. So, these reports are often complex and highly focused.
Strategic: Strategic dashboards check the “health” of the company to pinpoint the opportunities for expansion. This type conducts a more generalized view of the organization in comparison to other dashboard solutions.
Operational: Instead of focusing its attention on the general health of the company, the operational dashboard focuses on the KPIs. The tool analyzes the performance of the different branches of the company and provides information about the business efficiency in an easy-to-comprehend way.
Tactical: Mid-level management uses this reporting tool quite often for specific processes. The main goal of this report is to put together mid- to long-term strategies across different branches of the company.
3. Visualisation is the key
The comprehensive visualization of the data is a vital part of the BI dashboards. The human brain better comprehends visual information than textual. Thus, you need to display the data that will be interesting for your audience according to the rules of graphic design.
4. Data requires context
Your audience needs to know the context of the information to understand it fully. Analytics often cause more questions than provide answers. Do not forget to provide a specific time frame alongside the KPI metrics, and you should be fine.
5. Create a story
People like listening to stories. Use this to your advantage. A well-structured and compelling narrative will help to comprehend the report better. Yep, it is time to recall the basics of narrative creation from your creative writing course.
Final Thoughts
There are many factors that can cause a business to go bankrupt. However, human error remains one of the most common reasons why businesses fail. The business intelligence dashboard tool minimizes this risk by providing comprehensive data. Having the correct information during bad times can make or break a business.
Check out our website if you want excellent business intelligence services for a reasonable price.