NSE Option Chain: Live Data, Nifty 50, Bank Nifty & OI Analysis

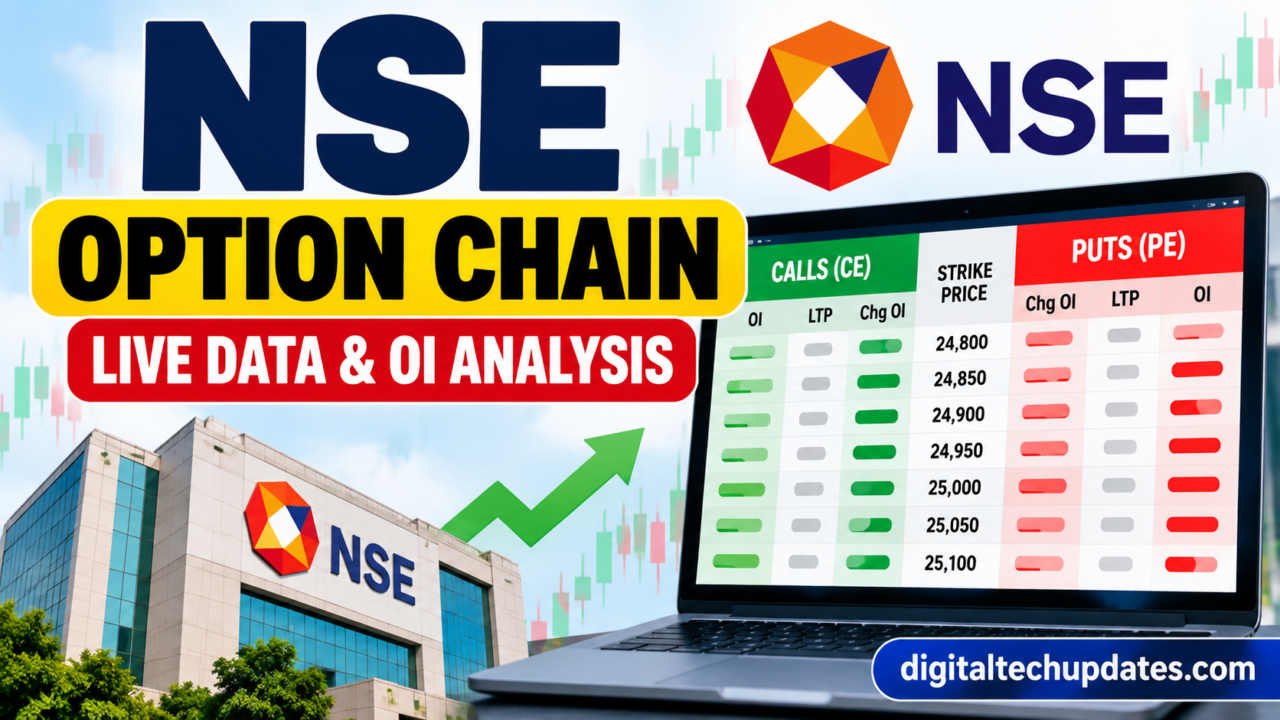
The NSE option chain is an important resource for traders who want to understand options market activity in India. It displays call and put option contracts along with strike prices, expiry dates, open interest (OI), trading volume, implied volatility, and option premiums.
Whether you are looking for the NSE option chain live, Nifty 50 option-chain data, Bank Nifty contracts, or OI analysis, learning how to read these figures can help you understand the derivatives market more clearly.
In this guide, you will learn how to access the official NSE option chain, interpret its key data fields, understand open interest, and avoid common mistakes when analyzing options.
What Is an NSE Option Chain?
An NSE option chain is a table of available options contracts listed on the National Stock Exchange of India. It organizes contracts by underlying instrument, strike price, and expiry date.
The option-chain interface helps users compare calls and puts and review the market information available for individual contracts.
Important information commonly displayed includes:
- Strike price: The price level specified in the option contract.
- Call option (CE): A contract that gives its buyer the right to buy the underlying asset under the contract’s terms.
- Put option (PE): A contract that gives its buyer the right to sell the underlying asset under the contract’s terms.
- Open interest (OI): The number of outstanding contracts that have not been closed or settled.
- Change in OI: The increase or decrease in outstanding contracts over a comparison period.
- Volume: The number of contracts traded during the relevant period.
- Implied volatility (IV): A market-derived estimate of expected future volatility reflected in an option’s price.
- Last traded price (LTP): The price of the most recent completed trade.
These indicators help traders study options activity, but none can reliably predict market direction on its own.
How to Check the NSE Option Chain Live
You can start with the official NSE India website to view its option-chain interface.
Official link: NSE India Option Chain
Follow these steps to access the relevant data:
- Open the official NSE option-chain page.
- Navigate to the equity derivatives option-chain section.
- Select the underlying instrument you want to examine, such as NIFTY.
- Select an available expiry date.
- Review the displayed strike prices.
- Compare the call and put data, including OI, change in OI, volume, IV, LTP, and bid-ask information.
- Check the displayed timestamp and refresh the page or data as needed.
The interface also provides options for selecting instruments and expiry dates and downloading displayed data where available.
Important: Data availability and update frequency can vary. Verify the timestamp rather than assuming every figure is continuously refreshed.
NSE Option Chain Nifty 50: How to Read It
The NSE option chain Nifty 50 section is useful for examining options contracts linked to the Nifty 50 index.
The table generally places call options on one side and put options on the other, with strike prices between them.
When reviewing Nifty 50 option-chain data, consider these factors:
- The current underlying index value.
- The selected expiry date.
- Strike prices near the underlying index level.
- Call and put premiums.
- Open interest and changes in open interest.
- Trading volume and bid-ask spreads.
- Implied volatility.
For example, a hypothetical option chain might display strike prices of 24,800, 24,900, and 25,000. These figures are illustrative only and are not current market quotes.
Comparing multiple strikes can help you understand how premiums and activity differ across contracts. Always check the actual displayed data before drawing conclusions.
NSE Option Chain Data: Important Fields Explained
Understanding each field is essential before using the data for analysis.
| Data field | What it means |
|---|---|
| OI | Outstanding contracts |
| Change in OI | Increase or decrease in outstanding contracts |
| Volume | Contracts traded during the relevant period |
| IV | Implied volatility |
| LTP | Last traded price |
| Bid price | Price currently offered by buyers |
| Ask price | Price currently requested by sellers |
| Bid quantity | Quantity available at the displayed bid |
| Ask quantity | Quantity available at the displayed ask |
| Strike price | Contract's specified price level |
The exchange displays these fields to help users examine individual contracts. However, a last traded price may not equal the next executable price, and large OI does not necessarily indicate that a contract is easy to trade at a favorable price.
NSE Option Chain OI Data: How to Understand Open Interest
Open interest is one of the most frequently examined metrics in options trading.
It measures the number of outstanding contracts rather than the number of trades completed during the day.
What does high OI mean?
High OI means that many contracts remain outstanding at a particular strike and expiry. Some traders monitor these concentrations when studying market positioning.
However, OI alone does not reveal the complete intentions of buyers and sellers or establish whether the market will rise or fall.
What does change in OI mean?
Change in OI measures how outstanding positions have changed over the selected comparison period.
| Observation | Possible interpretation | What to remember |
|---|---|---|
| OI increases | More contracts are outstanding | It does not establish market direction |
| OI decreases | Outstanding positions have reduced | The reason for the change may not be clear |
| Volume increases | More contracts have traded | Trading activity is not a directional signal |
| Premium changes alongside OI | Market pricing and positions are changing | Consider the underlying index, IV, and liquidity too |
Can OI identify support and resistance?
Some traders interpret relatively large put OI concentrations as potential support areas and large call OI concentrations as potential resistance areas.
These are analytical conventions, not guaranteed price levels. Market participants can change their positions, and the underlying index can move through previously identified levels.
For more reliable interpretation, compare OI with price movements, volume, expiry, and other market information.
NSE Option Chain Analysis: A Practical Approach
Effective NSE option chain analysis requires examining multiple indicators together.
Step 1: Check the underlying index
Determine which index or instrument the option contracts represent and examine its current price or index level.
Step 2: Select the correct expiry
Contracts with different expiry dates can have different premiums, volatility, and sensitivity to price changes.
Step 3: Compare nearby strike prices
Review call and put premiums, OI, and volume across relevant strikes.
Step 4: Examine changes in OI
Compare current OI with the previous reading or selected reference period. Avoid assuming that an increase automatically represents bullish or bearish positioning.
Step 5: Review implied volatility
IV affects option premiums and can change even when the underlying index moves very little.
Step 6: Consider liquidity
Review bid-ask spreads and quantities before assuming that a displayed LTP is a realistic execution price.
Step 7: Reassess your interpretation
Option-chain data changes as market participants trade and market conditions evolve. Avoid relying on a single reading.
NSE Option Chain Bank Nifty: What Is Different?
The NSE option chain Bank Nifty relates to options on the Nifty Bank index, which tracks banking-sector stocks.
Although the general option-chain concepts are similar, Bank Nifty and Nifty 50 have different underlying constituents and market exposures.
When reviewing Bank Nifty options, check:
- The selected underlying index.
- Available expiry dates and strike prices.
- Call and put OI.
- Changes in OI and trading volume.
- Premiums, IV, and bid-ask spreads.
- Relevant banking-sector developments.
Do not assume that Bank Nifty and Nifty 50 will move identically or that an indicator has the same significance in both markets.
For the latest available contracts, use the official NSE option-chain page.
NSE Option Chain Chart: How to Interpret the Data Visually
An NSE option-chain chart may display OI, changes in OI, volume, premiums, or other metrics across strike prices.
A chart can make it easier to compare data visually, but it does not replace checking the underlying contract information.
When interpreting an option-chain chart:
- Confirm the instrument and expiry date.
- Identify the metric plotted on each axis.
- Compare relevant call and put strikes.
- Check whether the chart displays total OI, changes in OI, or volume.
- Verify the timestamp and source of the data.
- Avoid treating a visual peak as a guaranteed market turning point.
Remember that different charting platforms may use different scales, calculations, or data-update intervals.
NSE Option Chain Data Today: What Should You Check?
If you are searching for NSE option chain data today, the most important step is to access a reliable source and confirm that the information corresponds to the current trading session.
Before interpreting the data, check:
- Whether the market is open or closed.
- The timestamp of the displayed figures.
- The underlying instrument and expiry.
- Whether OI and volume are reported in contracts.
- Whether the option premiums and bid-ask quotes have updated.
- Whether the selected contract is liquid enough for your intended use.
For historical comparisons, use the exchange’s available reports and clearly distinguish historical data from current market data.
You can also explore the NSE derivatives reports page for available exchange reports.
Never publish unverified figures as live data or assume that the most recent displayed price is an executable quote.
Nifty NSE Option Chain vs. Other Market Data
The phrase Nifty NSE option chain generally refers to options data for Nifty index contracts listed on NSE.
It is important to distinguish between different instruments:
- Nifty 50 option chain: Options linked to the Nifty 50 index.
- Bank Nifty option chain: Options linked to the Nifty Bank index.
- Stock option chain: Options linked to an individual stock, where listed and available.
- Sensex option chain: Options linked to the BSE Sensex index, associated with BSE rather than NSE.
Each instrument has its own contracts and data. Always verify the exchange and underlying before using a quote.
What about NSE option chain Sensex?
People may search for NSE option chain Sensex, but Sensex derivatives are associated with the Bombay Stock Exchange (BSE), not the NSE’s Nifty index derivatives.
For Sensex option-chain information, use the official BSE website, or another reliable provider that identifies the correct exchange and data source.
This distinction helps prevent confusion between two different index derivatives markets.
Common Mistakes When Using NSE Option Chain Data
Avoid these mistakes when reviewing options:
- Assuming high OI guarantees support or resistance.
- Treating a change in OI as a definite directional signal.
- Ignoring expiry dates.
- Confusing volume with open interest.
- Using stale prices as current quotes.
- Ignoring bid-ask spreads and liquidity.
- Treating an IV increase as a guaranteed prediction of a large market move.
- Confusing NSE Nifty derivatives with BSE Sensex derivatives.
- Trading without understanding the potential loss and the effects of time decay.
A careful approach combines accurate data, context, and risk management.
Frequently Asked Questions
1. Where can I check the NSE option chain?
You can visit the official NSE India Option Chain page, select the relevant instrument and expiry, and review the displayed contracts.
2. Is NSE option-chain data live?
The official interface displays market information, but you should check its timestamp, availability, and update behavior before treating a figure as current.
3. What is NSE option chain OI data?
OI data shows outstanding contracts for each option. It can help you examine positioning, but it does not independently predict market direction.
4. How do I check Nifty 50 option-chain data?
Open the NSE option-chain page, select NIFTY and the relevant expiry, then compare strike prices, call and put premiums, OI, volume, and IV.
5. What is the difference between Nifty and Bank Nifty option chains?
They represent different underlying indices. Nifty 50 covers a broad group of large companies, while Nifty Bank focuses on banking-sector stocks.
6. Can an option-chain chart predict market movement?
No chart can reliably predict market movement on its own. OI, volume, IV, and price action are useful analytical inputs, but each has limitations.
7. Is Sensex option-chain data available on NSE?
Sensex derivatives are associated with BSE. Use the appropriate exchange’s data rather than confusing Sensex contracts with NSE’s Nifty derivatives.
Conclusion
The NSE option chain provides valuable information about listed options contracts, including strike prices, call and put premiums, open interest, volume, and implied volatility.
By learning to read the data, checking the selected expiry, and verifying timestamps, you can develop a better understanding of the options market. Whether you examine Nifty 50, Bank Nifty, or other available derivatives, remember that option-chain indicators are not guaranteed trading signals.
Use reliable exchange information, understand the risks, and make decisions carefully.
Disclaimer: This article is for educational and informational purposes only and does not constitute investment advice. Options trading involves substantial risk and may result in significant losses. Verify exchange data and understand the risks before trading.

Thalla Lokesh
Thalla Lokesh is a Digital Marketing Strategist and SEO Specialist with over 12 years of experience in helping businesses grow their online presence. Since beginning his career in 2013, he has successfully worked across industries including healthcare, education, technology, and e-commerce. He specializes in search engine optimization (SEO), content marketing, keyword strategy, and link building, with a strong focus on delivering measurable results. Lokesh has helped brands achieve top rankings on Google through data-driven strategies, high-quality content, and ethical SEO practices aligned with search engine guidelines. As the founder of Honey Web Solutions , a Tirupati-based digital marketing company, he actively works with clients to improve organic traffic, lead generation, and online visibility. He also contributes expert insights on digital marketing trends, AI SEO, and content strategies through blogs and industry platforms.