CAGR Calculator – Calculate Compound Annual Growth Rate

CAGR (Compound Annual Growth Rate) tells you how quickly an investment has grown on an annualized basis over a specific period. Instead of looking only at the total percentage gain, CAGR shows the constant yearly growth rate that would turn your initial investment into its final value.
Use the CAGR calculator above to calculate the annualized return on a lump-sum investment using three simple inputs: your starting amount, ending amount, and investment period.
Whether you’re comparing stocks, mutual funds, real estate, fixed deposits, or business growth, CAGR can make long-term performance much easier to compare.
What Is CAGR?
CAGR stands for Compound Annual Growth Rate.
In simple terms, CAGR answers this question:
“What constant annual growth rate would my investment need to achieve to grow from its starting value to its ending value over this period?”
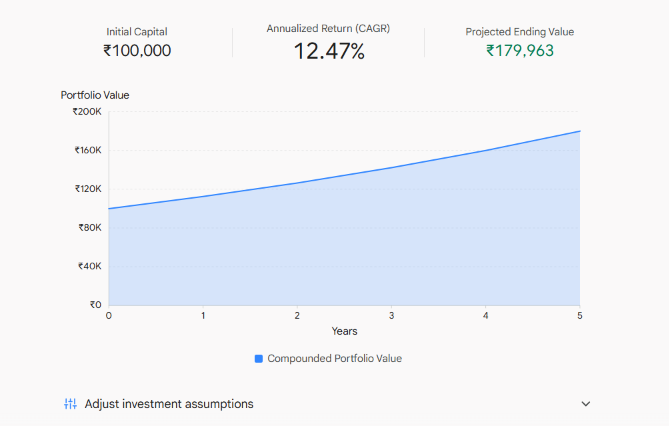
For example, suppose you invested ₹1,00,000 and it became ₹1,80,000 after five years. Your total gain is 80%, but simply saying “the investment returned 80%” doesn’t tell you how quickly that growth occurred.
The CAGR for this investment is approximately 12.47% per year.
This doesn’t mean the investment actually increased by exactly 12.47% every year. The real annual returns could have been very different. CAGR simply converts the beginning value, ending value, and holding period into one comparable annualized growth rate.
Why CAGR Matters
Looking only at total returns can be misleading when investments have different holding periods.
Consider these two hypothetical investments:
| Metric | Investment A | Investment B |
|---|---|---|
| Total Gain | 100% | 100% |
| Duration | 5 Years | 10 Years |
Both investments doubled the original capital, but Investment A achieved that result in half the time.
That’s why CAGR is useful. It puts investment growth on an annualized basis, making it easier to compare investments held for different periods.
For example:
- Investment A: 100% total return over 5 years
- Investment B: 100% total return over 10 years
The total return is identical, but the annualized growth rate is very different.
CAGR Formula
The standard CAGR formula is:
CAGR = (Ending Value ÷ Beginning Value)^(1 ÷ N) − 1
Where:
- Beginning Value (BV) = Initial investment
- Ending Value (EV) = Final investment value
- N = Number of years invested
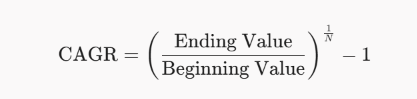
To express CAGR as a percentage, multiply the result by 100.
CAGR Formula Example
Suppose:
- Beginning Value = ₹1,00,000
- Ending Value = ₹1,80,000
- Investment Period = 5 years
The calculation is:
CAGR = (1,80,000 ÷ 1,00,000)^(1 ÷ 5) − 1
The result is approximately:
CAGR = 12.47%

In other words, the investment produced an annualized growth rate of about 12.47% over the five-year period.
The actual yearly returns could have moved up and down considerably.
How to Calculate CAGR Step by Step
You can calculate CAGR manually in a few steps.
Step 1: Find the Beginning Value
This is the amount you originally invested.
For example:
Beginning Value = ₹1,00,000
Step 2: Find the Ending Value
This is the value of the investment at the end of the period.
For example:
Ending Value = ₹1,80,000
Step 3: Determine the Investment Period
Calculate how long the investment was held.
For example:
Period = 5 years
Step 4: Apply the CAGR Formula
Use:
CAGR = (Ending Value ÷ Beginning Value)^(1 ÷ Years) − 1
Step 5: Convert the Result Into a Percentage
Multiply the decimal result by 100.
For the example above:
CAGR ≈ 12.47%
Instead of doing the calculation manually every time, you can enter the figures into the CAGR calculator above.
CAGR Example: ₹50,000 Becoming ₹1,00,000
Suppose you invest ₹50,000 and the investment grows to ₹1,00,000 over five years.
The total return is:
100%
But the CAGR is approximately:
14.87%
This shows why total return and CAGR are not interchangeable.
A 100% total gain sounds impressive, but the holding period tells you how quickly that gain was achieved.
CAGR Example: ₹1 Lakh Becoming ₹2 Lakh
Suppose an investment grows from ₹1,00,000 to ₹2,00,000 over 10 years.
The total return is again:
100%
However, the CAGR is approximately:
7.18%
Compare that with doubling ₹1,00,000 in five years, which produces a CAGR of approximately 14.87%.
The final gain is the same, but the annualized growth rate is dramatically different.
Total Return vs CAGR
Total return tells you how much an investment gained or lost over the entire holding period.
CAGR tells you the annualized rate required to connect the beginning and ending values.
| Asset Class | Overall Gain | Holding Period | CAGR |
|---|---|---|---|
| Mutual Fund | 80% | 5 Years | 12.47% |
| Stock Portfolio | 80% | 7 Years | 8.74% |
| Real Estate | 80% | 10 Years | 6.05% |
Which One Should You Use?
Use total return when you want to know the overall gain or loss.
Use CAGR when you want to compare investment growth across different holding periods.
Both metrics are useful, but they answer different questions.
CAGR vs Absolute Return
Absolute return measures the overall percentage gain or loss without annualizing the result.
For example, if ₹1,00,000 becomes ₹1,50,000, the absolute return is:
50%
It doesn’t matter whether the investment took two years, five years, or ten years to reach ₹1,50,000.
CAGR takes the holding period into account.
| Feature | CAGR | Absolute Return |
|---|---|---|
| Primary Metric | Annualized rate of growth | Total cumulative percentage gain |
| Time Horizon | Factors in exact duration | Ignores holding period |
| Compounding | Incorporates annual compounding | Simple point-to-point calculation |
| Best Used For | Multi-year asset comparisons | Short-term holdings (< 1 year) |
This makes CAGR more useful when comparing investments held for different lengths of time.
CAGR vs XIRR
CAGR and XIRR are both useful return measures, but they are designed for different situations.
CAGR is generally appropriate for a single lump-sum investment, where you have one starting value and one ending value.
XIRR is more appropriate when there are multiple cash flows, such as SIP investments, additional purchases, withdrawals, or irregular deposits.
| Feature | CAGR | XIRR |
|---|---|---|
| Cashflows | Single lump-sum initial deposit | Multiple cash inflows and outflows |
| Frequency | One-time entry and exit | Periodic contributions (SIPs, dividends) |
| Complexity | Straightforward calculation | Solved via iterative algorithms |
Example: Mutual Fund SIP
Imagine you invest ₹5,000 every month into a mutual fund.
There isn’t one single beginning investment amount because money enters the investment at different dates.
A ₹5,000 investment made today has a different investment period from another ₹5,000 invested two years later.
In this situation, XIRR can account for the timing of each cash flow, while CAGR cannot properly represent those individual investment dates.
Is CAGR Suitable for SIP Investments?
Not usually.
CAGR works best when you invest a lump sum at the beginning and measure its value at the end of the investment period.
SIPs involve recurring investments at different points in time.
For example:
- January investment has a longer holding period.
- February investment has a slightly shorter holding period.
- Later investments have progressively shorter holding periods.
Because XIRR considers the dates and amounts of individual cash flows, it is generally a better measure for evaluating SIP returns.
For lump-sum investments → CAGR
For SIPs and irregular cash flows → XIRR
CAGR for Stocks
CAGR can be useful when evaluating the long-term growth of a stock.
Suppose a stock was purchased for ₹200 and later reached ₹500 after eight years.
CAGR can show the annualized growth rate between those two prices.
However, investors should remember that stock CAGR based only on price may not include dividends.
If dividends were received and reinvested, the calculation should account for those cash flows when appropriate.
CAGR also doesn’t show how volatile the stock was during the journey.
A stock could have fallen 50% at one point and subsequently recovered, yet its beginning-to-ending CAGR could still look attractive.
CAGR for Mutual Funds
CAGR is commonly used to evaluate the annualized performance of a mutual fund over a period when comparing a lump-sum investment.
For example, you could compare:
- 3-year CAGR
- 5-year CAGR
- 10-year CAGR
However, don’t use CAGR alone when evaluating a mutual fund.
Also consider factors such as:
- Investment objective
- Risk level
- Expense ratio
- Benchmark performance
- Volatility
- Drawdowns
- Fund manager and strategy
- Consistency across market cycles
A higher historical CAGR does not automatically mean a fund is better or safer.
CAGR for Real Estate
CAGR can also be used to estimate the annualized appreciation of property.
Suppose a property was purchased for ₹40 lakh and is worth ₹70 lakh after eight years.
CAGR can estimate the annualized growth rate between the purchase value and current value.
However, a simple property CAGR may not represent the complete investment return.
Real estate investors may also need to consider:
- Rental income
- Maintenance expenses
- Property taxes
- Registration costs
- Brokerage
- Renovation expenses
- Financing costs
- Selling costs
Therefore, CAGR is best viewed as a measure of value appreciation rather than necessarily the complete return on a property investment.
CAGR for Business Growth
CAGR isn’t limited to investments.
Businesses can use CAGR to measure the growth of:
- Revenue
- Profit
- Customers
- Assets
- Market size
- Sales
For example, if a company’s revenue increases from ₹10 crore to ₹25 crore over five years, CAGR can show the annualized growth rate over that period.
This makes it easier to compare growth between businesses or across different periods.
CAGR Growth Table: What Can ₹1 Lakh Become?
The power of compounding becomes easier to understand when you see how different CAGR rates affect the same starting investment.
| CAGR | 5 Years | 10 Years | 15 Years | 20 Years |
|---|---|---|---|---|
| 8% | ₹1.47 lakh | ₹2.16 lakh | ₹3.17 lakh | ₹4.66 lakh |
| 10% | ₹1.61 lakh | ₹2.59 lakh | ₹4.18 lakh | ₹6.73 lakh |
| 12% | ₹1.76 lakh | ₹3.11 lakh | ₹5.47 lakh | ₹9.65 lakh |
| 15% | ₹2.01 lakh | ₹4.05 lakh | ₹8.14 lakh | ₹16.37 lakh |
| 20% | ₹2.49 lakh | ₹6.19 lakh | ₹15.41 lakh | ₹38.34 lakh |
These figures illustrate why even seemingly small differences in annualized growth can become significant over long periods.
The table is a mathematical illustration, not a prediction of investment returns.
How to Calculate the CAGR You Need to Reach a Financial Goal
CAGR can also work in reverse.
Suppose you have ₹1,00,000 today and want it to become ₹5,00,000 in 10 years.
You can calculate the CAGR required to reach that target:
Required CAGR = (Target Value ÷ Current Value)^(1 ÷ Years) − 1
In this example, the required CAGR is approximately:
17.46%
This can help investors understand the growth rate their target requires.
However, a required CAGR should not be confused with a guaranteed or expected return.
What Factors Affect CAGR?
Several factors influence the CAGR calculated for an investment.
1. Beginning Value
The starting amount determines the base from which growth is measured.
2. Ending Value
A higher final value generally results in a higher CAGR when the beginning value and investment period remain unchanged.
3. Investment Period
Time has a major effect on CAGR.
The same total return achieved over a shorter period produces a higher CAGR than if it took many more years.
4. Reinvestment
For investments where income distributions are reinvested, compounding can contribute significantly to long-term growth.
5. Cash Flows
Additional deposits and withdrawals can make a simple CAGR calculation inappropriate. In such cases, a cash-flow-sensitive measure such as XIRR may be more appropriate.
Advantages of CAGR
Easy to Understand
CAGR converts investment growth into one annualized percentage.
Useful for Comparisons
It makes it easier to compare investments with different holding periods.
Highlights Long-Term Growth
CAGR focuses on the beginning and ending values over a defined period rather than short-term fluctuations.
Useful for Financial Planning
Historical CAGR can help investors understand how quickly an investment has grown in the past and can be used for illustrative financial projections.
Works Across Different Assets
CAGR can be applied to investments such as stocks, mutual funds, property and other assets when the calculation assumptions are appropriate.
Limitations of CAGR
CAGR is useful, but it isn’t a complete measure of investment performance.
CAGR Hides Volatility
CAGR only considers the beginning value, ending value and time period.
It doesn’t tell you what happened in between.
An investment could experience substantial gains and losses while still producing the same CAGR as a relatively stable investment.
CAGR Doesn’t Show Risk
Two investments can have identical CAGRs while having very different risk levels.
CAGR Doesn’t Handle Multiple Cash Flows Well
If you make multiple investments or withdrawals during the period, a basic CAGR calculation can be misleading.
XIRR may be more appropriate when cash flows occur on different dates.
Historical CAGR Doesn’t Predict Future Returns
A stock, fund, property, or business that achieved a particular CAGR in the past isn’t guaranteed to repeat that performance.
CAGR Isn’t the Same as Actual Annual Returns
If an investment has a CAGR of 12%, that doesn’t mean it returned exactly 12% in every year.
CAGR is a smoothed annualized rate.
CAGR vs Annual Returns
These two concepts are often confused.
Suppose an investment produces the following yearly returns:
- Year 1: +25%
- Year 2: −10%
- Year 3: +18%
- Year 4: +5%
The actual returns vary every year.
CAGR compresses the overall beginning-to-ending growth into a single annualized figure.
Therefore:
Annual return = what happened during a particular year
CAGR = annualized growth between two values over the entire period
When Should You Use CAGR?
CAGR is particularly useful when:
- You made a lump-sum investment.
- You want to compare long-term investment performance.
- You need to annualize a total return.
- You are comparing assets held for different periods.
- You want to measure historical business growth.
- You want to understand how quickly an investment grew over time.
For investments involving regular contributions or withdrawals, consider using XIRR instead.
CAGR Calculator: What Do You Need?
To calculate CAGR, you only need three numbers:
1. Initial Investment
How much did you start with?
2. Final Investment Value
How much is the investment worth at the end?
3. Investment Period
How many years did the investment remain invested?
Enter these values into the CAGR calculator to get the annualized growth rate.
CAGR Frequently Asked Questions
What is CAGR in simple words?
CAGR is the annualized growth rate of an investment over a specific period. It represents the constant yearly rate that would turn the starting value into the ending value.
What is the CAGR formula?
The formula is:
CAGR = (Ending Value ÷ Beginning Value)^(1 ÷ Number of Years) − 1
Multiply the result by 100 to express it as a percentage.
Is CAGR the same as annual return?
No. CAGR is an annualized rate calculated over the entire investment period. Actual annual returns can be higher or lower in individual years.
Is CAGR better than absolute return?
Neither is universally better. Absolute return shows the total gain or loss, while CAGR accounts for the time taken to achieve that result. CAGR is generally more useful when comparing investments held for different periods.
Does CAGR account for volatility?
No. CAGR does not show the ups and downs experienced during the investment period.
Does CAGR predict future performance?
No. CAGR is based on historical beginning and ending values. Past CAGR does not guarantee future returns.
Is CAGR suitable for SIP investments?
A basic CAGR calculation is generally not appropriate for SIPs because investments occur at different dates. XIRR is usually more suitable for evaluating SIP returns.
What is the difference between CAGR and XIRR?
CAGR is generally used for a single lump-sum investment measured between a beginning and ending value. XIRR accounts for multiple cash flows occurring on different dates.
Can CAGR be negative?
Yes. If the ending value is lower than the beginning value, the CAGR will be negative.
For example, if ₹1,00,000 falls to ₹80,000 over several years, the resulting CAGR will be below 0%.
Can CAGR be more than 100%?
Yes. CAGR can exceed 100% when an investment grows very rapidly over a relatively short period.
Can CAGR be used for stocks?
Yes. CAGR can be used to measure the annualized growth between a stock’s beginning and ending prices. However, dividends and other cash flows may need to be considered separately depending on what return you want to measure.
Can CAGR be used for real estate?
Yes. CAGR can estimate annualized property value appreciation. However, a complete real estate return may also include rental income and costs associated with owning and selling the property.
Final Takeaway
CAGR is one of the simplest ways to understand how quickly an investment has grown over time.
Instead of looking only at a total gain such as 50%, 100%, or 200%, CAGR puts that gain into an annualized context.
For a lump-sum investment, you generally need only:
Beginning Value + Ending Value + Investment Period
The CAGR calculator makes the calculation quick, while the formula helps you understand how the result is derived.
Just remember that CAGR is a historical growth measure, not a guarantee of future returns. It also doesn’t capture volatility or handle multiple cash flows as effectively as XIRR.
For the most meaningful investment analysis, use CAGR alongside other measures such as total return, risk, volatility, drawdown, and—where applicable—XIRR.

Thalla Lokesh
Thalla Lokesh is a Digital Marketing Strategist and SEO Specialist with over 12 years of experience in helping businesses grow their online presence. Since beginning his career in 2013, he has successfully worked across industries including healthcare, education, technology, and e-commerce. He specializes in search engine optimization (SEO), content marketing, keyword strategy, and link building, with a strong focus on delivering measurable results. Lokesh has helped brands achieve top rankings on Google through data-driven strategies, high-quality content, and ethical SEO practices aligned with search engine guidelines. As the founder of Honey Web Solutions , a Tirupati-based digital marketing company, he actively works with clients to improve organic traffic, lead generation, and online visibility. He also contributes expert insights on digital marketing trends, AI SEO, and content strategies through blogs and industry platforms.